AR Infographic Brochures
Key Methods
Pitch, Budget, Concept, Interaction Design, AR Dev
My Role
Proposal, AR Interaction Design, AR Dev
Team
Alan (AR) x Lovage (Graphic Artist)
Tools
Procreate, Photoshop, Spark AR, JS
Duration
3-5 weeks each
Client
National Arts Council of Singapore
Overview
AYN: Arts In Your Neighbourhood
AYN is a district-wide event run twice a year by the Singapore National Arts Council, each time at a new district., to celebrate the arts and culture of the district.
AYN 2020 Kallang, AYN 2021 Pasir Ris
For 2 of the events, I partnered with Lovage, a local graphic arts, to propose, produce and deliver printed infographics of the districts with interactive AR popups featuring district landmarks, as an AR filter for NAC’s instagram page.
Plan
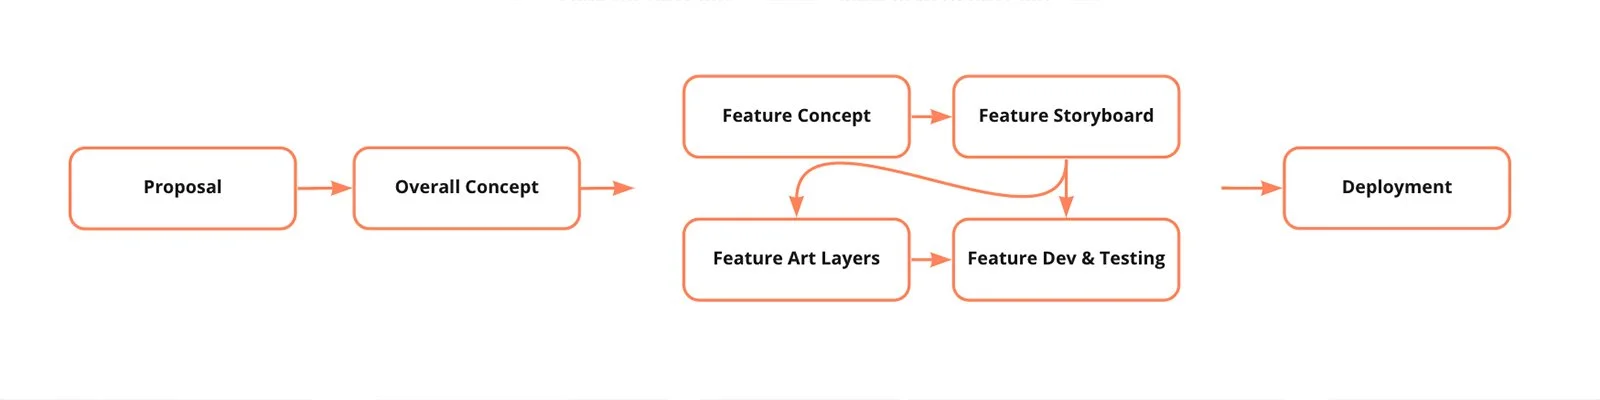
Overall Concept Research

Features and landmarks in the district were compiled into inspiration boards, long lists and identified on the map. Selections were decided based on historical and art significance, unique motifs and opportunity for storytelling. This was an iterative discussion with NAC to shortlist and determine which landmarks to show on print and which to expand on as an AR landmark.
AR Design & Storyboarding
8-10 AR feature landmarks are selected, and followed a 3 step design process - concept, storyboard, and art layers reference.
Iterative Design Process
The concept and storyboard is first proposed to NAC, and approved or iterated before art layer references are prepared if necessary for Lovage to produce them. This process is repeated for all 8-10 landmarks, followed by actual prototyping and implementation in SparkAR.

Concept & Art Layers Reference for the concept - Visualise how Kallang Gasworks transitioned into a modern day park

* Final experience - framerate is reduced for GIF compression
AR Development
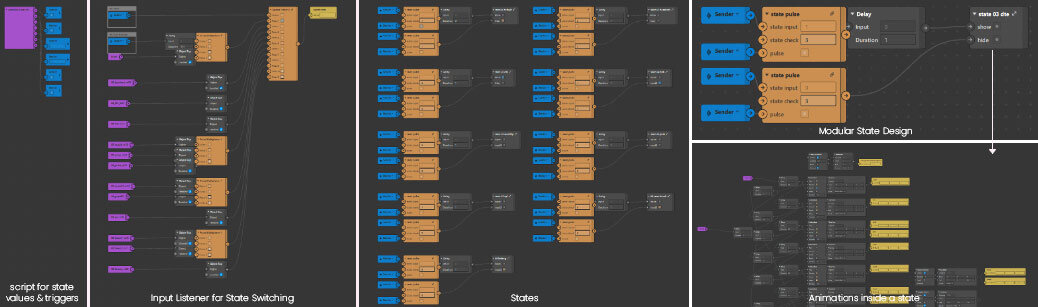
Developing for Scale
A state machine approach was used to ensure a modular setup that is replicable and scalable to any number of AR landmarks. Each AR landmark feature is a state. This approach allows for custom animation patches for each AR landmark state to be modified independently, while the overall structure remains uniform. Both JavaScript and patches are used.
There are 4 key elements to the state machine structure (as shown in the snippet above).
Script - triggers state switching events and provides the current & next state values.
Input Listener - input patches listens to user interactions and sends signals into the script.
Modular States - each state is represented by a patch group. The patch listens to switch state events and activates only if current state matches their state.
State Contents - each patch group contains a chain of custom animations for showing and hiding the popups when entering or exiting its state.
Testing & Deployment
Iterative Testing
When a new component is ready, such as an AR landmark, a test link is produced for the team to test. Feedbacks covered technical errors like bugs & glitches and usability improvements like visibility of art elements, animation effects, etc.
Design Improvements
Between the 1st and 2nd AR infographic, one notable design change is the removal of the AR back button. Instead, users can tap anywhere to return to the main selection. This was incorporated after observing users tap the screen, then locating the back button when their initial action had no feedback. As the only interaction is to enter and exit an AR landmark, this was a more intuitive approach, and was incorporated into the 2nd infographic.
For more details on AR Infographic Brochures, please reach me at mail@alanng.me